What is Redacted Maps?
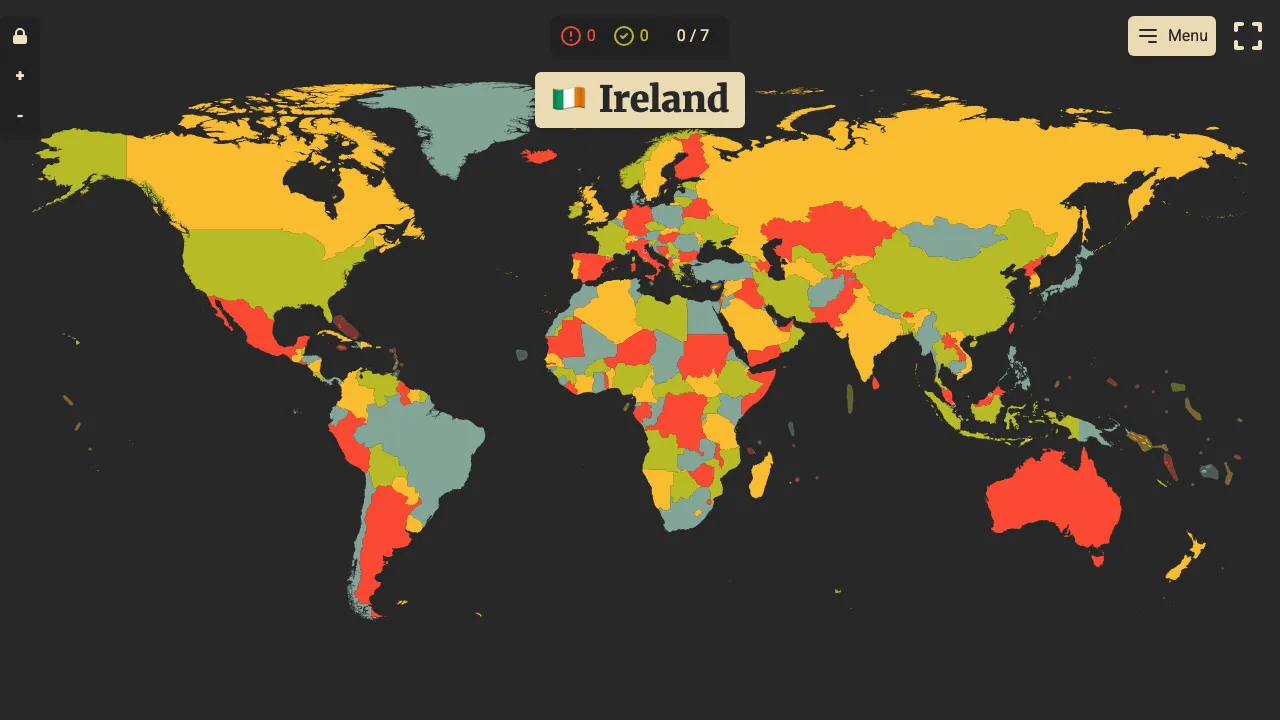
Redacted Maps shows you a colored statistical map with its title concealed. Your task is to work out what the data measures. The geography is visible; the mystery is why particular areas score high or low. That creates a different kind of geography puzzle. Recognizing a state or country is useful, but the answer depends on interpreting a pattern across the map, such as a regional cluster or an unexpected outlier.
What information can you uncover?
The map includes a low-to-high color legend and begins with three peeks. A peek lets you inspect hidden data for a selected area. Wrong guesses gradually reveal more context: the unit after the first miss, a category after the second, and a hint after the third. The final guess becomes a choice among four candidate answers. Hatched areas mean data is unavailable there. They should not be treated as places with a value of zero.
How to solve the daily data mystery
1. Look across the whole map and note the strongest highs, lows, and regional patterns. 2. Use a peek on an informative area, such as an outlier, rather than choosing a location at random. 3. Propose the statistic or subject you think explains the pattern and submit the guess. 4. Combine newly revealed units, categories, or hints with the map before guessing again. 5. If you reach the final multiple-choice stage, eliminate options that fail to explain the visible distribution.
Tips for reading a map logically
First distinguish totals from rates. A raw count can favor populous places, while a percentage or per-person measure may produce a very different pattern. The unit clue is particularly valuable for that distinction. Check both an area your theory explains and one it struggles with. A convincing idea should account for the low end as well as the high end. Avoid committing to a familiar stereotype when the actual map points somewhere else.
How to play
- Study the clue — a map outline, flag, photo or set of facts.
- Enter your guess; the game tells you how close you are (distance, direction or matching attributes).
- Refine each guess until you pin down today's location.