What Is HeatMapQuest?
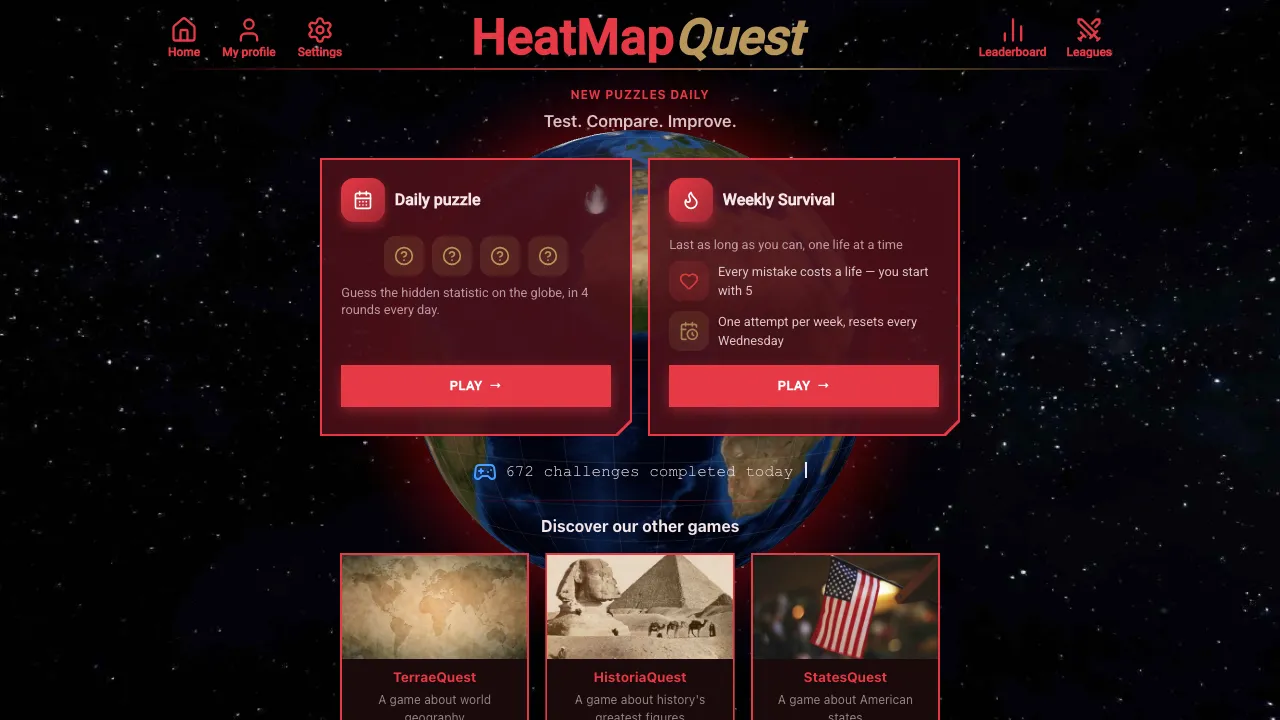
HeatMapQuest is a daily geography and data-visualization guessing game built around an interactive 3D globe. Instead of asking you to identify a country from its shape or flag, it colors countries according to a hidden real-world statistic and challenges you to work out what the map represents. Each daily game contains four rounds. In every round, you see a new heatmap and four possible statistics. Your job is to recognize the geographic pattern and select the statistic that best explains it. The data can cover subjects such as population, GDP, life expectancy, forest cover, and many other country-level measures, so succeeding requires a mixture of geography knowledge, general knowledge, and visual deduction.
The Heatmap Twist
The globe itself is the clue. Imagine a round where several highly populated Asian countries stand out strongly while sparsely populated regions appear at the opposite end of the scale. Your four choices might look something like: - Total population - Life expectancy - Forest coverage - GDP per capita Rather than answering a conventional trivia question, you compare the distribution across countries and ask which option would realistically create that world pattern. A different round might emphasize wealthy countries, tropical regions, or countries with particular demographic characteristics. Because several statistics can produce superficially similar maps, individual countries at the extremes are often more useful clues than the overall appearance.
How to Play HeatMapQuest
- Study the 3D globe. Look around the map and notice which countries sit at the high and low ends of the displayed gradient.
- Read the four choices. Each option represents a possible real-world statistic behind the heatmap.
- Compare the geographic patterns. Think about countries you know well and test whether their colors make sense for each possible statistic.
- Choose the best match. Submit the statistic you believe generated the map, then continue through the remaining rounds of the daily challenge.
How to Read the Globe
You do not need to know the precise value for every country. HeatMapQuest is primarily about recognizing relative patterns. For example, suppose one map makes Canada, Russia, and several other large countries visually prominent. A land-area-related option would deserve serious consideration. If smaller but wealthy economies dominate instead, a per-capita economic measure might make more sense. The useful question is usually not "What value does this country have?" but rather "Which of these four statistics would rank these countries in roughly this pattern?"
Strategy Tips
Start with countries you know best Use familiar reference points such as the United States, China, India, Japan, Brazil, Russia, Australia, and major European countries. Their relative positions can quickly rule out several choices. Look for extreme cases One unusual country can be more informative than an entire continent. If a country known for an exceptionally high or low value stands out exactly as expected, that is strong evidence for a particular answer. Distinguish totals from per-capita statistics Large-population countries often dominate total measures while smaller wealthy countries can lead per-capita rankings. Checking which type of country sits near the top is an effective way to separate similar-looking options. Check multiple regions Do not decide from one cluster alone. Rotate the globe and compare Asia, Europe, Africa, the Americas, and Oceania before committing to an answer. A theory that works in one region may fall apart elsewhere. Use elimination You rarely need to identify the statistic instantly. Test each candidate against a handful of recognizable countries and eliminate choices that produce obvious contradictions.